What is “Threadripper”?
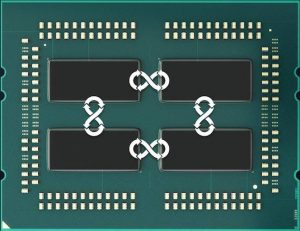
“Threadripper” (code-name ZP aka “Zeppelin”) is simply a combination of inter-connected Ryzen dies (“nodes”) on a single socket (TR4) that in effect provide a SMP system-on-a-single-socket – without the expense of multiple sockets, cooling solutions, etc. It also allows additional memory channels (4 in total) to be provided – thus equaling Intel’s HEDT solution.
It is worth noting that up to 4 dies/nodes can be provided on the socket – thus up to 32C/64T – can be enabled in the server (“EPYC”) designs – while current HEDT systems only use 2 – but AMD may release versions with more dies later on.
 In this article we test CPU core performance; please see our other articles on:
- AMD Threadripper 1950X Review and Benchmarks – 4-channel DDR4 Cache & Memory Performance
- NUMA performance improvement for ThreadRipper in Sandra SP2
Hardware Specifications
We are comparing the top-of-the-range Threadripper (1950X) with HEDT competition (Intel SKL-X) as well as normal desktop solutions (Ryzen, Skylake) which also serves to compare HEDT with the “normal” desktop solution.
| CPU Specifications | AMD Threadripper 1950X | Intel i9 9700X (SKL-X) | AMD Ryzen 1700X | Intel i7 6700K (SKL) | Comments | |
| Cores (CU) / Threads (SP) | 16C / 32T | 10C / 20T | 8C / 16T | 4C / 8T | Just as Ryzen, TR has the most cores though Intel has just announced new SKL-X with more cores. | |
| Speed (Min / Max / Turbo) | 2.2-3.4-3.9GHz (22x-34x-39x) [note ES sample] | 1.2-3.3-4.3GHz (12x-33x-43x) | 2.2-3.4-3.9GHz (22x-34x-39x) [note ES sample] | 0.8-4.0-4.2GHz (8x-40x-42x) | SKL has the highest base clock but all CPUs have similar Turbo clocks | |
| Power (TDP) | 180W | 150W | 95W | 91W | TR has higher TDP than SKL-X just like Ryzen so may need a beefier cooling system | |
| L1D / L1I Caches | 16x 32kB 8-way / 16x 64kB 8-way | 10x 32kB 8-way / 10x 32kB 8-way | 8x 32kB 8-way / 8x 64kB 8-way | 4x 32kB 8-way / 4x 32kB 8-way | TR and Ryzen’s instruction caches are 2x data (and SKL/X) but all caches are 8-way. | |
| L2 Caches | 16x 512kB 8-way (8MB total) | 20x 1MB 16-way (20MB total) | 8x 512kB 8-way (4MB total) | 4x 256kB 8-way (1MB total) | SKL-X has really pushed the boat out with a 1MB L2 cache that dwarfs all other CPUs. | |
| L3 Caches | 4x 8MB 16-way (32MB total) | 13.75MB 11-way | 2x 8MB 16-way (16MB total) | 8MB 16-way | TR actually has 2 sets of 2 L3 caches rather than a combined L3 cache like SKL/X. | |
| NUMA Nodes |
2x 16GB each | no, unified 32GB | no, unified 16GB | no, unified 16GB | Only TR has 2 NUMA nodes | |
Thread Scheduling and Windows
Threadripper’s topology (4 cores in each CCX, with 2 CCX in one node and 2 nodes) makes things even more compilcated for operating system (Windows) schedulers. Effectively we have a 2-tier NUMA SMP system where CCXes are level 1 and nodes are level 2 thus the scheduling of threads matters a lot.
Also keep in mind this is a NUMA system (2 nodes) with each node having its own memory; while for compatibility AMD recommends (and the BIOS defaults) to “UMA” (Unified) “interleaving across nodes” – for best performance the non-interleaving mode (or “interleaving across CCX”) should be used.
What all this means is that you likely need a reasonably new operating system – thus Windows 10 / Server 2016 – with a kernel that has been updated to support Ryzen/TR as Microsoft is not likely to care about old verions.
Native Performance
We are testing native arithmetic, SIMD and cryptography performance using the highest performing instruction sets (AVX2, AVX, etc.). Ryzen/TR support all modern instruction sets including AVX2, FMA3 and even more like SHA HWA (supported by Intel’s Atom only) but has dropped all AMD’s variations like FMA4 and XOP likely due to low usage.
Results Interpretation: Higher values (GOPS, MB/s, etc.) mean better performance.
Environment: Windows 10 x64, latest AMD and Intel drivers. Turbo / Dynamic Overclocking was enabled on both configurations.
| Native Benchmarks | AMD Threadripper 1950X | Intel 9700X (SKL-X) | AMD Ryzen 1700X | Intel 6700K (SKL) | Comments | |
 |
||||||
 |
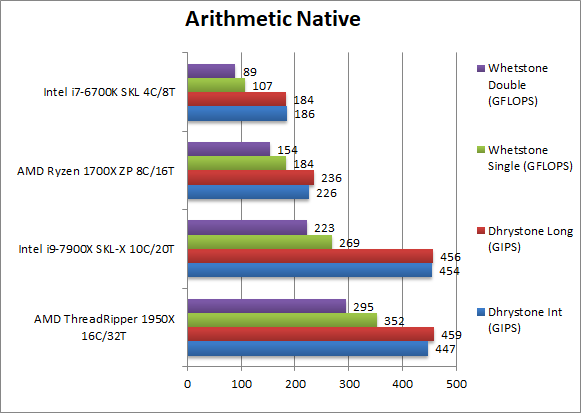
Native Dhrystone Integer (GIPS) | 447 [-2%] | 454 | 226 | 186 | TR can keep up with SKL-X and scales well vs. Ryzen. |
|
Native Dhrystone Long (GIPS) | 459 [+1%] | 456 | 236 | 184 | An Int64 load does not change results. |
|
Native FP32 (Float) Whetstone (GFLOPS) | 352 [+30%] | 269 | 184 | 107 | Finally TR soundly beats SKL-X by 30% and scales well vs. Ryzen. |
|
Native FP64 (Double) Whetstone (GFLOPS) | 295 [+32%] | 223 | 154 | 89 | With a FP64 work-load the lead inceases slightly. |
| Unlike Ryzen which soundly dominated Skylake (albeit with 2x more cores, 8 vs. 4), Threadripper does not have the same advantage (16 vs. 10) thus it can only beat SKL-X in floating-point work-loads where it is 30% faster, still a good result. | ||||||
 |
||||||
 |
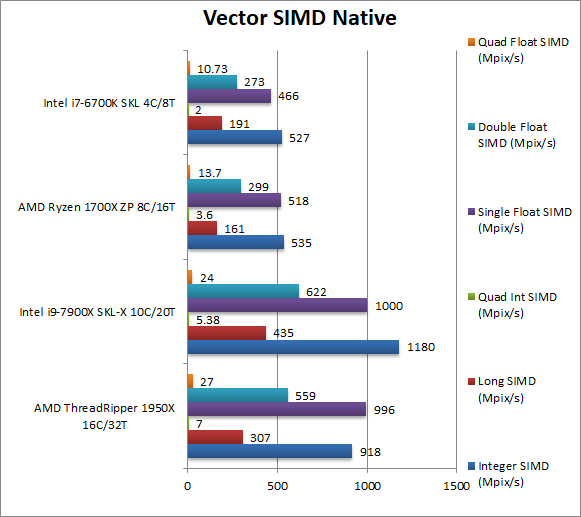
Native Integer (Int32) Multi-Media (Mpix/s) | 918 [-22%] | 1180 | 535 | 527 | With AVX2/FMA SKL-X is just too strong, with TR 22% slower. |
|
Native Long (Int64) Multi-Media (Mpix/s) | 307 [-29%] | 435 | 161 | 191 | With Int64 AVX2 TR is almost 20% slower than SKL-X. |
|
Native Quad-Int (Int128) Multi-Media (Mpix/s) | 7 [+30%] | 5.4 | 3.6 | 2 | This is a tough test using Long integers to emulate Int128 without SIMD and here TR manages to be 30 faster! |
|
Native Float/FP32 Multi-Media (Mpix/s) | 996 [=] | 1000 | 518 | 466 | In this floating-point AVX2/FMA vectorised test TR manages to tie with SKL-X. |
|
Native Double/FP64 Multi-Media (Mpix/s) | 559 [-10%] | 622 | 299 | 273 | Switching to FP64 SIMD code, TR is now 10% slower than SKL-X. |
|
Native Quad-Float/FP128 Multi-Media (Mpix/s) | 27 [+12%] | 24 | 13.7 | 10.7 | In this heavy algorithm using FP64 to mantissa extend FP128 but not vectorised – TR manages a 12% win. |
| In vectorised AVX2/FMA code we see TR lose in most tests, or tie in one – and only shine in emulation tests not using SIMD instruction sets. Intel’s SIMD units – even without AVX512 that SKL-X brings – are just too strong for TR just as we saw Ryzen struggle against normal Skylake. | ||||||
 |
||||||
 |
Crypto AES-256 (GB/s) | 27.1 [-21%] | 34.4 | 14 | 15 | All CPUs support AES HWA – but TR/Ryzen memory is just 2400Mt/s vs 3200 that SKL-X enjoys (+33%) thus this is a good result; TR seems to use its channels pretty effectively. |
|
Crypto AES-128 (GB/s) | 27.4 [-18%] | 33.5 | 14 | 15 | Similar to what we saw above TR is just 18% slower which is a good result; unfortunately we cannot get the memory over 2400Mt/s. |
|
Crypto SHA2-256 (GB/s) | 32.2 [+2.2x] |
14.6 | 17.1 | 5.9 | Like Ryzen, TR’s secret weapon is SHA HWA which allows it to soundly beat SKL-X over 2.2x faster! |
|
Crypto SHA1 (GB/s) | 34.2 [+30%] | 26.4 | 17.7 | 11.3 | Even with SHA HWA, the multi-buffer AVX2 implementation allows SKL-X to beat TR by 16% but it still scores well. |
|
Crypto SHA2-512 (GB/s) | 6.34 [-41%] | 10.9 | 3.35 | 4.38 | SHA2-512 is not accelerated by SHA HWA (version 1) thus TR has to use the same vectorised AVX2 code thus is 41% slower. |
| TR’s secret crypto weapon (as Ryzen) is SHA HWA which allows it to soundly beat SKL-X even with 33% less memory bandwidth; provided software is NUMA-enabled it seems TR can effectively use its 4-channel memory controllers. | ||||||
 |
||||||
 |
Black-Scholes float/FP32 (MOPT/s) | 436 [+35%] | 322 | 234.6 | 129 | In this non-vectorised test TR bets SKL-X by 35%. The choice for financial analysis? |
|
Black-Scholes double/FP64 (MOPT/s) | 366 [+32%] |
277 | 198.6 | 109 | Switching to FP64 code,TR still beats SKL-X by over 30%. So far so great. |
|
Binomial float/FP32 (kOPT/s) | 165 [+2.46x] |
67.3 | 85.6 | 27.25 | Binomial uses thread shared data thus stresses the cache & memory system; we would expect TR to falter – but nothing of the sort – it is actually over 2.5x faster than SKL-X leaving it in the dust! |
|
Binomial double/FP64 (kOPT/s) | 83.7 [+27%] |
65.6 | 45.6 | 25.54 | With FP64 code the situation changes somewhat – TR is only 27% faster but still an appreciable lead. Very strange not to see Intel dominating this test. |
|
Monte-Carlo float/FP32 (kOPT/s) | 91.6 [+42] |
64.3 | 49.1 | 25.92 | Monte-Carlo also uses thread shared data but read-only thus reducing modify pressure on the caches; TR reigns supreme being 40% faster. |
|
Monte-Carlo double/FP64 (kOPT/s) | 68.7 [+34%] |
51.2 | 37.1 | 19 | Switching to FP64, TR is just 34% faster but still a good lead |
| Intel should be worried: across all financial tests, 64-bit or 32-bit floating-point workloads TR soundly beats SKL-X by a big margin that even a 16-core version may not be able to match. But should these tests be vectorisable using SIMD – especially AVX512 – then we would fully expect Intel to win. But for now – for financial workloads there is only one choice: TR/Ryzen!!! | ||||||
 |
||||||
 |
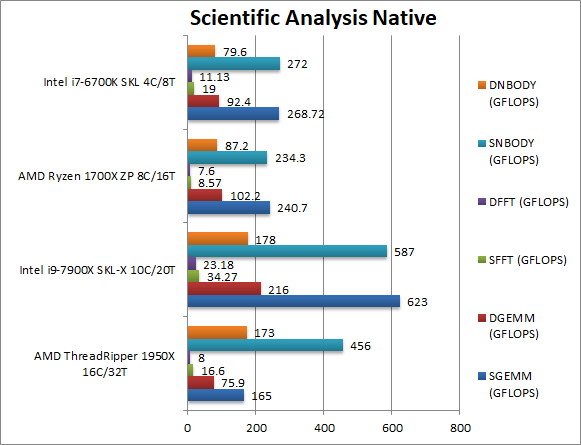
SGEMM (GFLOPS) float/FP32 | 165 [?] | 623 | 240.7 | 268 | We need to implement NUMA fixes here to allow TR to scale. |
|
DGEMM (GFLOPS) double/FP64 | 75.9 [?] | 216 | 102.2 | 92.2 | We need to implement NUMA fixes here to allow TR to scale. |
|
SFFT (GFLOPS) float/FP32 | 16.6 [-51%] | 34.3 | 8.57 | 19 | FFT is also heavily vectorised but stresses the memory sub-system more; here TR cannot beat SKL-X and is 50% slower – but scales well against Ryzen. |
|
DFFT (GFLOPS) double/FP64 | 8 [-65%] | 23.18 | 7.6 | 11.13 | With FP64 code, the gap only widens with TR over 65% slower than SKL-X and little scaling over Ryzen. |
|
SNBODY (GFLOPS) float/FP32 | 456 [-22%] | 587 | 234 | 272 | N-Body simulation is vectorised but has many memory accesses to shared data – and here TR is only 22% slower than SKL-X but again scales well vs Ryzen. |
|
DNBODY (GFLOPS) double/FP64 | 173 [-2%] | 178 | 87.2 | 79.6 | With FP64 code TR almost catches up with SKL-X |
| With highly vectorised SIMD code TR cannot do as well – but an additional issue is that NUMA support needs to be improved – F/D-GEMM shows how much of a problem this can be as all memory traffic is using a single NUMA node. | ||||||
 |
||||||
 |
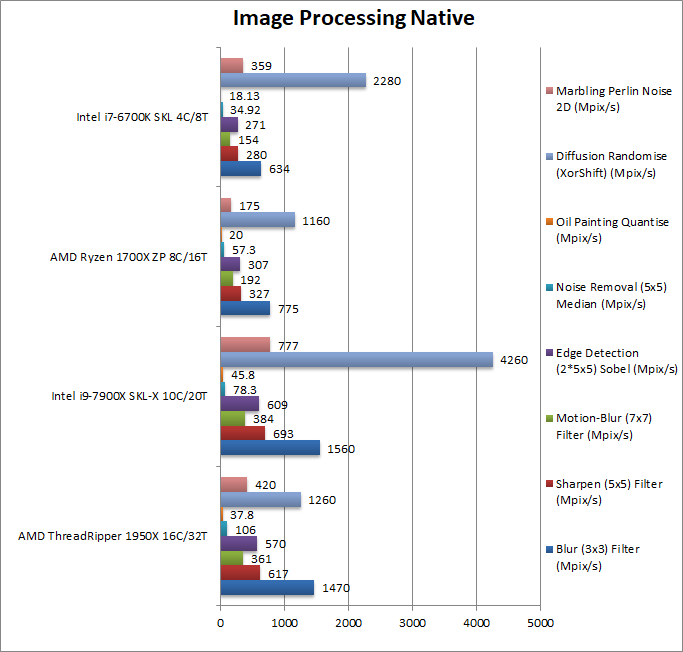
Blur (3×3) Filter (MPix/s) | 1470 [-6%] | 1560 | 775 | 634 | In this vectorised integer AVX2 workload TR does surprisingly well against SKL-X just 6% slower. |
|
Sharpen (5×5) Filter (MPix/s) | 617 [-10%] | 693 | 327 | 280 | Same algorithm but more shared data used sees TR now 10%, more NUMA optimisations needed. |
|
Motion-Blur (7×7) Filter (MPix/s) | 361 [-6%] | 384 | 192 | 154 | Again same algorithm but even more data shared now TR is 6% slower. |
|
Edge Detection (2*5×5) Sobel Filter (MPix/s) | 570 [-6%] | 609 | 307 | 271 | Different algorithm but still AVX2 vectorised workload – TR is still 6% slower. |
|
Noise Removal (5×5) Median Filter (MPix/s) | 106 [+35%] | 78.3 | 57.3 | 34.9 | Still AVX2 vectorised code but TR does far better, it is no less than 35% faster than SKL-X! |
|
Oil Painting Quantise Filter (MPix/s) | 37.8 [-17%] | 45.8 | 20 | 18.1 | TR does worst here, it is 17% slower than SKL-X but still scales well vs. Ryzen. |
|
Diffusion Randomise (XorShift) Filter (MPix/s) | 1260 [?] | 4260 | 1160 | 2280 | This 64-bit SIMD integer workload is a problem for TR but likely NUMA issue again as not much scaling vs. Ryzen. |
|
Marbling Perlin Noise 2D Filter (MPix/s) | 420 [-45%] | 777 | 175 | 359 | TR really does not do well here but does scale well vs. Ryzen, likely some code optimisation is needed. |
As TR (like Ryzen) supports most modern instruction sets now (AVX2, FMA, AES/SHA HWA) it does well but generally not enough to beat SKL-X; unfortunately the latter with AVX512 can potentially get even faster (up to 100%) increasing the gap even more.
While we’ve not tested memory performance in this article, we see that in streaming tests (e.g. AES, SHA) – even more memory bandwidth is needed to feed all the 16 cores (32 threads) and being able to run the memory at higher speeds would be appreciated.
NUMA support is crucial – as non-NUMA algorithms take a big hit (see GEMM) where performance can be even lower than Ryzen. While complex server or scientific software won’t have this problem, most programs will not be NUMA aware.
Software VM (.Net/Java) Performance
We are testing arithmetic and vectorised performance of software virtual machines (SVM), i.e. Java and .Net. With operating systems – like Windows 10 – favouring SVM applications over “legacy” native, the performance of .Net CLR (and Java JVM) has become far more important.
Results Interpretation: Higher values (GOPS, MB/s, etc.) mean better performance.
Environment: Windows 10 x64, latest Intel drivers. .Net 4.7.x (RyuJit), Java 1.8.x. Turbo / Dynamic Overclocking was enabled on both configurations.
| VM Benchmarks | AMD Threadripper 1950X | Intel 9700X (SKL-X) | AMD Ryzen 1700X | Intel 6700K (SKL) | Comments | |
 |
||||||
 |
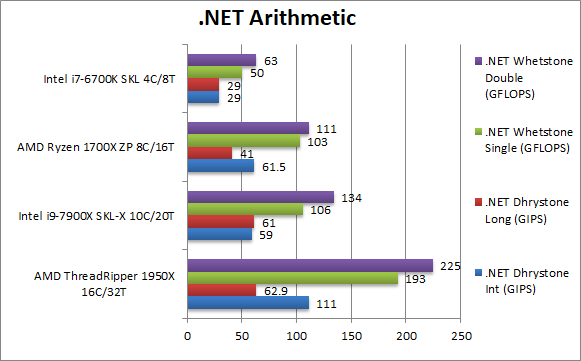
.Net Dhrystone Integer (GIPS) | 111 [+88%] | 59 | 61.5 | 29 | .Net CLR integer performance starts off very well with TR 88% faster than SKL-X an incredible result! This is *not* a fluke as Ryzen scores incredibly too. |
|
.Net Dhrystone Long (GIPS) | 62.9 [+3%] | 61 | 41 | 29 | TR cannot match the same gain with 64-bit integer, but still just about manages to beat SKL-X. |
|
.Net Whetstone float/FP32 (GFLOPS) | 193 [+82%] | 106 | 103 | 50 | Floating-Point CLR performance is pretty spectacular with TR (like Ryzen) dominating – it is no less than 82% faster than SKL-X! |
|
.Net Whetstone double/FP64 (GFLOPS) | 225 [+67%] | 134 | 111 | 63 | FP64 performance is also great with TR 67% faster than SKL-X an absolutely huge win! |
| It’s pretty incredible, for .Net applications TR – like Ryzen – is king! It is pretty incredible that is is between 60-80% faster in all tests (except 64-bit integer). With more and more applications (apps?) running under the CLR, TR (like Ryzen) has a bright future. | ||||||
 |
||||||
 |
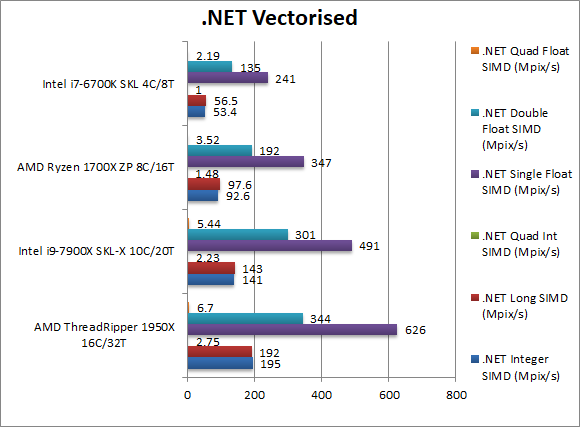
.Net Integer Vectorised/Multi-Media (MPix/s) | 195 [+38%] |
141 | 92.6 | 53.4 | In this non-vectorised test, TR is almost 40% faster than SKL-X not as high as what we’ve seen before but still significant. |
|
.Net Long Vectorised/Multi-Media (MPix/s) | 192 [+34%] |
143 | 97.6 | 56.5 | With 64-bit integer workload this time we see no changes. |
|
.Net Float/FP32 Vectorised/Multi-Media (MPix/s) | 626 [+27%] |
491 | 347 | 241 | Here we make use of RyuJit’s support for SIMD vectors thus running AVX/FMA code; Intel strikes back through its SIMD units but TR is a comfortably 27% faster than it. |
|
.Net Double/FP64 Vectorised/Multi-Media (MPix/s) | 344 [+14%] |
301 | 192 | 135 | Switching to FP64 SIMD vector code – still running AVX/FMA – TR’s lead falls to 14% but it is still a win! |
| Taking advantage of RyuJit’s support for vectors/SIMD (through SSE2, AVX/FMA) allows SKL-X to gain some traction – TR remains very much faster up to 40%. Whatever the workload, it seems TR just loves it. | ||||||
 |
||||||
 |
Java Dhrystone Integer (GIPS) | 1000 [+16%] | 857 | JVM integer performance is only 16% faster on TR than SKL-X – but a win is a win. | ||
|
Java Dhrystone Long (GIPS) | 974 [+26%] | 771 | With 64-bit integer workloads, TR is now 26% faster. | ||
|
Java Whetstone float/FP32 (GFLOPS) | 231 [+48%] | 156 | With a floating-point workload TR increases its lead to a massive 48%, a pretty incredible result. | ||
|
Java Whetstone double/FP64 (GFLOPS) | 183 [+14%] | 160 | With FP64 workload the gap reduces way down to 14% but it is still faster than SKL-X. | ||
| Java performance is not as incredible as we’ve seen with .Net, but TR is still 15-50% faster than SKL-X – no mean feat! Again if you have Java workloads, then TR should be the CPU of choice. | ||||||
 |
||||||
 |
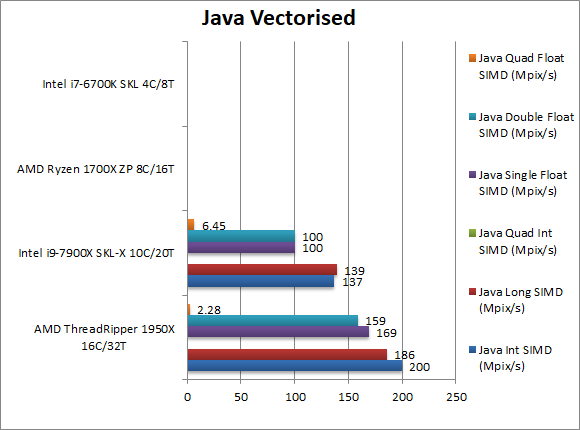
Java Integer Vectorised/Multi-Media (MPix/s) | 200 [+45%] | 137 | The JVM does not support SIMD/vectors, thus TR uses its scalar prowess to be 45% faster. | ||
|
Java Long Vectorised/Multi-Media (MPix/s) | 186 [+33%] | 139 | With 64-bit vectorised workload Ryzen is still 33% faster. | ||
|
Java Float/FP32 Vectorised/Multi-Media (MPix/s) | 169 [+69%] | 100 | With floating-point, TR is a massive 69% faster than SKL-X a pretty incredible result. | ||
|
Java Double/FP64 Vectorised/Multi-Media (MPix/s) | 159 [+59%] | 100 | With FP64 workload TR’s lead falls just a little to 59% – a huge win over SKL-X. | ||
| Java’s lack of vectorised primitives to allow the JVM to use SIMD instruction sets (aka SSE2, AVX/FMA) gives TR (like Ryzen) free reign to dominate all the tests, be they integer or floating-point. It is pretty incredible that neither Intel CPU can come close to its performance. | ||||||
TR (like Ryzen) absolutely dominates .Net and Java benchmarks with CLR and JVM code running much faster than the latest Intel SKL-X – thus current and future applications running under CLR (WPF/Metro/UWP/etc.) as well as server JVM workloads run great on TR. For .Net and Java code, TR is the CPU to get!
SiSoftware Official Ranker Scores
Final Thoughts / Conclusions
It may be difficult to decide whether AMD’s design (multiple CCX units, multiple dies/nodes on a socket) is “cool” and supporting it effectively is not easy for programmers – be they OS/kernel or application – but when it works it works extremely well! There is no doubt that Threadripper can beat Skylake-X at the same cost (approx 1,000$) though using more coress just as its little (single-die) brother Ryzen.
Scalar workloads, .Net/Java workloads just fly on it – but highly vectorised AVX2/FMA workloads only perform competitively; unfortunately once AVX512 support is added SKL-X is likely to dominate effectively these workloads though for now it’s early days.
It’s multiple NUMA node design – unless running in UMA (unified) mode – requires both OS and application support, otherwise performance can tank to Ryzen levels; while server and scientific programs are likely to be so – this is a problem for most applications. Then we have its dual-CCX design which further complicate workloads, effectively being a 2nd NUMA level; we can see inter-core latencies being 4 tiers while SKL-X only has 2 tiers.
In effect both platforms will get better in the future: Intel’s SKL-X with AVX512 support and AMD’s Threadripper with NUMA/CCX memory optimisations (and hopefully AVX512 support at one point). Intel are also already launching newer versions with more cores (up to 18C/36T) while AMD can release some server EPYC versions with 4 dies (and thus up to 32C/64T) that will both push power envelopes to the maximum.
For now, Threadripper is a return to form from AMD.
Pingback: AMD Threadripper Review & Benchmarks – 4-channel DDR4 Cache & Memory Performance – SiSoftware
Pingback: Sandra Platinum (2017) SP1 – SiSoftware
Pingback: SiSoftware Sandra Platinum (2017) Released! – SiSoftware